
Welcome! You are currently logged in.
Log out:
What is the E-Zone System? |
The E-Zone System shows an Entry Zone (for buying) and an Exit Zone (for selling) The zones are displayed historically along with the stock price. The crucial difference between the E-Zone System and other products is that we project into the future what the zones will be for the next day. In addition to the daily E-Zones, we provide weekly E-Zones that project the Entry and Exit zones for the coming week, beginning with the next Monday. These are for investors and traders who prefer a broader, longer view. |
||||||||||||
What is the purpose of the
|
The E-Zones are there to help you...Know when to sell, when to buy and when to be out of the market. Know where the smart entry points are, where to average down, and where to begin taking profits. Avoid costly "Buy & Hold" mistakes. Improve your swing trading strategies and techniques. A bit of history...Market down-turns can take a severe toll on investors using a "Buy & Hold" strategy. The E-Zone System was originally designed to help an investor protect his portfolio by showing when it is time to "take money off the table" and when it is safe to begin "averaging down". In use since 2002, the E-Zone System soon became a favorite timing tool for swing and day-traders as well as investors. We invite you to add the E-Zone System to your tool kit. |
||||||||||||
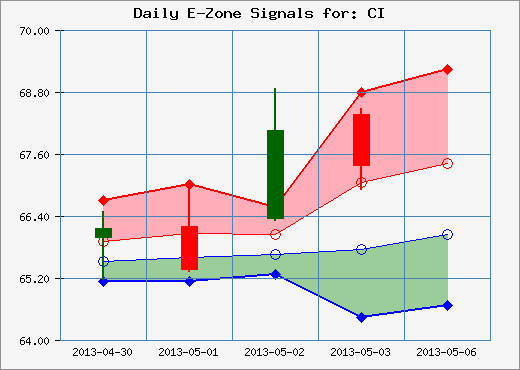
What do E-Zones look like?This is an example of an E-Zone chart. Note that the stock prices in candlestick format are overlaid on top of the E-Zones. After reading the information below, come back and take a look at this chart. Note the nice swing trade in the beginning of May. The price for Cigna fell into the Entry Zone on May 1, 2013 and subsequently, on May 2, price moved up quite nicely, actually past the top of the Exit Zone. |
|
||||||||||||
Step 1 -- Basic ConceptsThe E-Zone System shows the Entry Zone (green) and Exit Zone (red) projected one trading period (one day or one week) into the future. The basic trading process is as follows: When opening price falls within one of the zones, take the corresponding action as shown in the diagram at the right. |
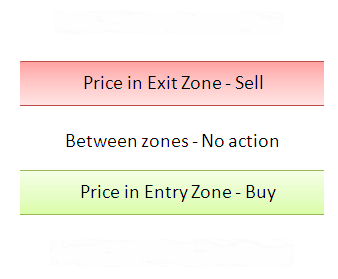
|
||||||||||||
Step 2 -- Check the direction of the E-Zones |
E-Zones may be slanting UP or DOWNLimit your trading as follows: BUY when price is in the Entry Zone and the bottom of the Entry Zone is slanting upward and the Open is above the previous Low; otherwise, take no action. SELL when price is in the Exit Zone and the top of Exit Zone is slanting downward and the Open is below the previous High; otherwise, take no action. Use the last two data points on the E-Zone chart to see whether the zones are flat or sloping upward or downward. Look for our detailed guidance displayed right next to the chart on the E-Zone Quick Quote page. |
||||||||||||
Step 3 -- Out-of-Zone Guidance |
There are times when Buy or Sell guidance is valid even if the price is NOT within a zoneSpecial Conditions are required for out of zone signals Condition #1: If Zone is sloping Up - previous day closed above its open, today's open is above yesterday's low, yesterday's close was above the day before yesterday close and the day before yesterday closed above its open Condition #2: If Zone is sloping Down - previous day closed below its open, today's open is below yesterday's high, yesterday's close was below the day before yesterday close and the day before yesterday closed below its open Price above top of Exit Zone
Price below bottom of Entry Zone
Sound complicated? Don't worry. Look for our detailed guidance displayed right next to the chart on the E-Zone Quick Quote page. |
||||||||||||
Step 4 -- Timing, or when to take action and trade |
Beginning of day or End of day?Because the E-Zone System shows the Entry Zone and Exit Zone projected one trading period (one day or one week) into the future, it is not recommended that trading be done throughout the day. Next Day's OpenCheck the E-Zones after the close of trading. When the guidance provided next to the chart does actually recommend a trade (Buy or Sell) it always says you should execute that trade at the next day (or week's) open using the guidance from "Tomorrow's Call" (or "Monday's Call" for those using the weekly E-Zones). This is the preferred approach. At the CloseIn today's market, institutions tend to trade heavily at the end of the day and their activity can swing prices significantly. If you are reluctant to trade at the open or if you are a day-trader who wants to be flat at the end of the day, you can use the E-Zones guidance in the last minutes of trading; however, be sure to use the guidance from "Today's Call", not "Tomorrow's Call" (or "Monday's Call" for those using the weekly E-Zones). |
||||||||||||
Example -- When Zones are slanting UPThis kind of situation often occurs when a stock or ETF is making a bullish move upward. The slanting angle of the lines (also known as the slope) is found by looking only at the most recent two data points. We will tell you if the angle is significant enough to trade. Note that we are only concerned with the TOP of the Exit Zone (red) and the BOTTOM of the Entry Zone (green). |
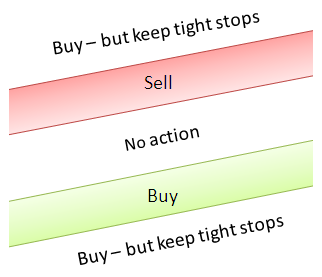
|
||||||||||||
Example -- When Zones are slanting DOWNThis kind of situation often occurs when a stock or ETF is making a bearish move downward. The slanting angle of the lines (the slope) is found by looking only at the most recent two data points. We will tell you if the angle is significant enough to trade. Again, note that we are only concerned with the TOP of the Exit Zone (red) and the BOTTOM of the Entry Zone (green). |
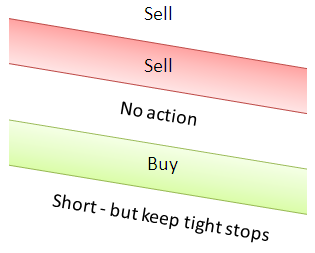
|
||||||||||||
Today's Call and E-Zone GuidanceWe don't leave you on your own to puzzle over the charts. The E-Zone System always offers a signal (the Daily Call) based on the day's current price. The E-Zone System also provides market guidance for the following day. This guidance tells you what to do if the next day's price falls within the Entry Zone or Exit Zone or above the Exit Zone or below the Entry Zone. |
|
||||||||||||
See E-Zones in action... |
We provide a live example of what the E-Zone System looks like. It even includes an explanation of important features. See today's daily and weekly charts for QQQ and read the daily call, tomorrow's guidance and next week's guidance. [ Click here ] to see it all now! |
||||||||||||