
Welcome! You are currently logged in.
Log out:
|
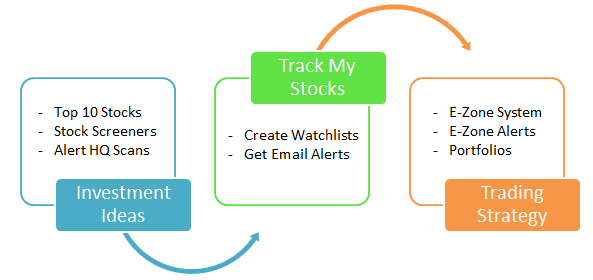
Top 10 Stocks:
our top picks for investors who prefer a longer view Stock Screeners: powerful yet easy to use
Alert HQ: latest break outs, swing signals and much, much more
|
|
The E-Zone System -
a Daily or Weekly trading strategy
Know when to sell, when to buy and when to be out of the market
Get the latest Buy and Sell zones for all the stocks in your portfolio
New trading signals provided every day
Ideal for swing trading
|
Question: Sheesh, there's a lot of content on this site! How do I get started?
Answer: It depends on where you're starting from. Let's take a couple of examples.
(1) You already have a stock in mind and you are looking for information.
Start with Stock Search. Enter a stock symbol in the search box at the top right of the page and click on the magnifying glass icon. This will take you to the Stock Search Results page where you can find our opinion of the stock. We calculate three scores for the stock: a financial score, a valuation score and trend performance score. We combine these scores and provide a Buy/Sell/Hold/Avoid opinion. In addition, we provide a wealth of financial and technical detail as well as an interactive chart and links to best of breed web sites where you can get more information on this stock.
(2) You are looking for investment ideas and would like to see a selection of interesting stocks or ETFs.
In this case, you might want to look at some of our pre-defined screens. Take a look at the black menu bar at the top of the page. You can start browsing through the Alert HQ section and work your way to the right through the Stocks to Watch and the ETF Analysis sections. For now, you can skip the Stock Screeners and jump to the Top 10 Stocks. Each of these menu items has a drop down that lists all the various content available. These screens are all updated several times per week. Click [ this link ] to read more about this section of our site.
(3) You are a power user and want to dig for stocks based on certain financial or technical criteria that are important to your investment style.
Now is when you want to check out our Stock Screeners. They all provide the ability to incorporate both financial and technical criteria into your screening process. They allow you to find stocks in trends, stocks that are breaking out, gaps, Bollinger Band breakouts, stocks with moving averages that are changing direction, etc. There is a healthy number of other technical analysis criteria available, as well. In like manner, you can screen for stocks that are classic value stocks, stocks that have the financial profile of growth stocks, stocks that have seen recent increases in earnings, revenues or dividends, etc. Click [ this link ] for an overview of all four of our unique screeners.
(4) OK, you've found an interesting stock and you'd like some guidance on how to determine a good entry point or maybe how to trade in and out of the stock as it rides a trend.
Now you are ready to check out our E-Zone System. This trading system projects entry and exit zones for the next trading period - one day (or one week) ahead. Its purpose is let you know when to sell, when to buy and when to be out of the market. Try it out at the E-Zone Quick Quote page.
Our screens tell you where a stock has been in past trading days but the E-Zone System looks ahead and gives you guidance on how to react tomorrow or next week.Question: What's this Alert HQ stuff all about?
Answer: There is a bunch of functionality that we group under the "Best Investment Ideas and ETF Ranking" area of the site. Alert HQ is an important part of that along with our stock screeners, Top 10 Stocks, etc.Basically, we run a bunch of stock screens offline and then we publish the results online at the Alert HQ, Stocks to Watch, ETF and Top 10 Stocks sections of our site. The screens are run three times a week for those that are based on daily data.
Click [ this link ] to read more about this section of our site.
Question: I've tried the Reversal Alerts and Trend Busters but it seems after I buy, the stock immediately goes down and I find I have to wait to make up what I lost. Can't you provide better timing with your Buy signals?
Answer: It's perfectly fine to use Reversal Alerts or Trend Busters to find stocks that are making moves; however, there is an old investor saying: "Don't buy the breakout." This is because a stock will often undergo a pull-back before resuming a bullish move.
We suggest you use our E-Zone System to pick the best entry point. The E-Zone System will often show a breakout as a move above the neutral zone and up into the Sell zone. Since the E-Zone System combines adaptive mean-reversion, moving averages and statistical analysis in its calculations, its rules and predicted zones can guide you to an optimal entry point at the optimal timeQuestion: I like your Reversal Alerts but I'd like to filter them so I only look at those stocks with solid financials. How can I do that?
Answer: Use one of our stock screeners. Start by picking a Value preset, then modify it so it matches your financial criteria. Then go into the technical analysis part of the screener and set the Trade-Radar Reversal Alerts drop down to "Buy Signal".
The screener will now find any stocks with solid financials that have registered a Buy signal within the last few weeks. Click on the different tabs within the screener results to dig into the details on each stock.Question: I invest in ETFs. How can your site help me?
Answer: We have a whole section devoted to ETF Analysis. We originally developed the "Trend Performance Score" concept in order to rank ETFs and show how strong their current trend happens to be. For example, ETFs at the top of an ETF Scorecard are in strong bullish trends, the ones in the middle of the ranking tend to be going sideways and the ones at the bottom are in bearish trends.
In addition, we have screens of ETFs that show change in Trend Performance Score. This is a good way to identify ETFs that are in the process of breaking out.Question: I like to invest by finding the best stocks in the hottest sectors. Can you do that?
Answer: We have a couple of ways of doing that.
Under the Screeners menu item, go to our Industry Inspector. You will see a list of industries and sectors in alphabetical order. There are numerous financial and technical factors that allow you to sort on column headings in order to find hot sectors. You can also use the screener section located just above the list to zero in on the industries that meet your financial and/or technical criteria.
Either way, clicking on an industry brings up a list of the stocks in that industry. Clicking on a stock takes you to the Stock Search page where all kinds of details about the stock are provided including a chart and links to information on other sites.
An alternative approach is to go to the Sector and Style Scorecards under the ETFs menu item. We rank 30 sectors and styles (by styles we mean large cap, small cap, etc.) according to Trend Performance Score. Those sector ETFs at the top of the list represent the hottest sectors in the market. Use one of our stock screeners and enter one of the sectors you identified on the Scorecard page. Enter any other criteria you feel identifies a "best" stock and click the Search button. You will get a list of the best stocks in that sectorQuestion: I don't like trading too often. I like to hold a stock for at least a few months if not longer. Your site seems oriented to quick-triggered trading. What about my investment style?
Answer: It's true we have lots of Buy and Sell signals based on daily data but we also have plenty of signals based on weekly data. The expectation is that you wouldn't use weekly signals to quickly trade in and out.
In general, when going to many of the Alert HQ screens from the menu drop downs you will, by default, be taken to a page showing signals based on daily data. Look for a link just above the table of stock data that will take you to the same screen only based on weekly data. On the other hand, the ETF Analysis menu clearly differentiates between scorecards based on daily data versus those based on weekly data.
A few screens come only in weekly format. The Ebb and Flow Report, for example, is based on weekly data and highlights those stocks that are rising or falling, often within a channel.
Also, our E-Zone System provides both daily and weekly trading signals. Focusing on the weekly signals will be more in keeping with your investment style.Question: What's the best way to trade the stocks on your Trend Leaders list? It's such a big list when the market is moving up and sometimes I see the same stock listed for days or weeks and I worry the trend is running out of steam.
Answer: To get the freshest Trend Leaders, look for the link just above the table of stock data that will take you to the "New Additions to the List" page.
To really dig into the Trend Leaders, it is best to use the Premium Stock Screener. First, go down to the Technical Analysis Patterns and Signals part of the screener and check the check box titled "Currently in Strong Bullish Trend." Then go back up to the top of the screener and set the Change in 50-DMA drop down to "Flipped to Bullish." Just to the left of the 50-DMA dropdown, there is another drop down with dates in the recent past. Pick one of the dates a few days or a week in the past. Click the Search button and you will get a list of Trend Leaders that have been just recently identified.Question: Why is there so much data on all of your screens and reports? For example, when I look at the Alert HQ pages, I expect to see a list of stocks but there are big tables of data. I'm not sure what I'm supposed to be looking at.
Answer: The first two columns are usually the stock symbol and company name for the stocks showing up on the particular screen. These two columns would correspond to your simple list of stocks; however, we provide a few other useful features.
Hover over the symbol and a small chart appears so you can get a quick glimpse of price action. Click on a symbol and it takes you to the Stock Search page where even more detail is provided along with an interactive chart and links to other web sites where you can dig into the stock even further.
The reason why we provide a big table of data is so you can sort the list of stocks. If you click on a column heading, the table is sorted accordingly. For example, if you are looking at a screen of Trend Busters and you want to find the ones with the highest dividend yield, just click on the corresponding column heading. That will sort from lowest to highest. Click again on the same column heading and it will sort from highest to lowest. The same kind of thing can be done if you were instead interested in the stocks with the lowest PE Ratio or highest Cash Flow Yield, etc.